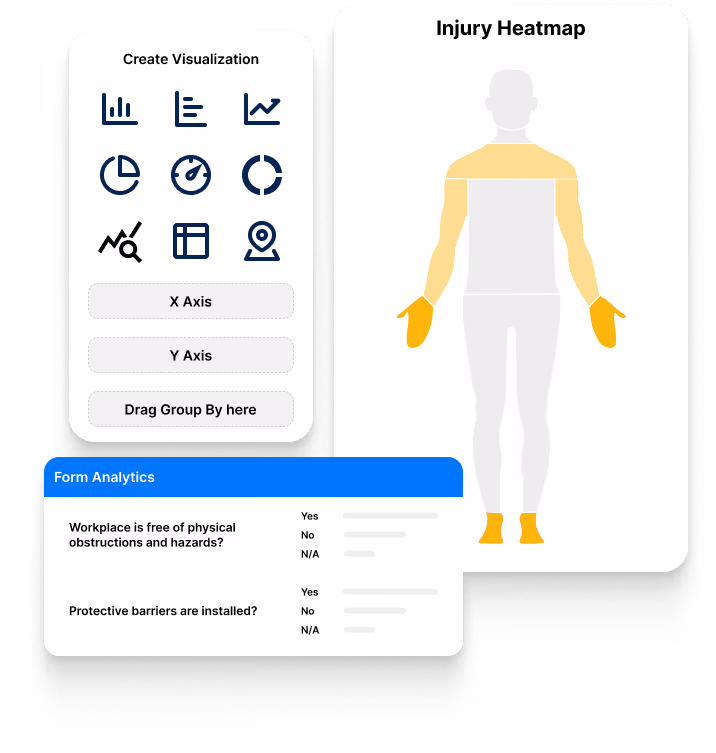
Visualize leading indicators and metrics from safety and quality data across locations and combine into simple, role-based dashboards.
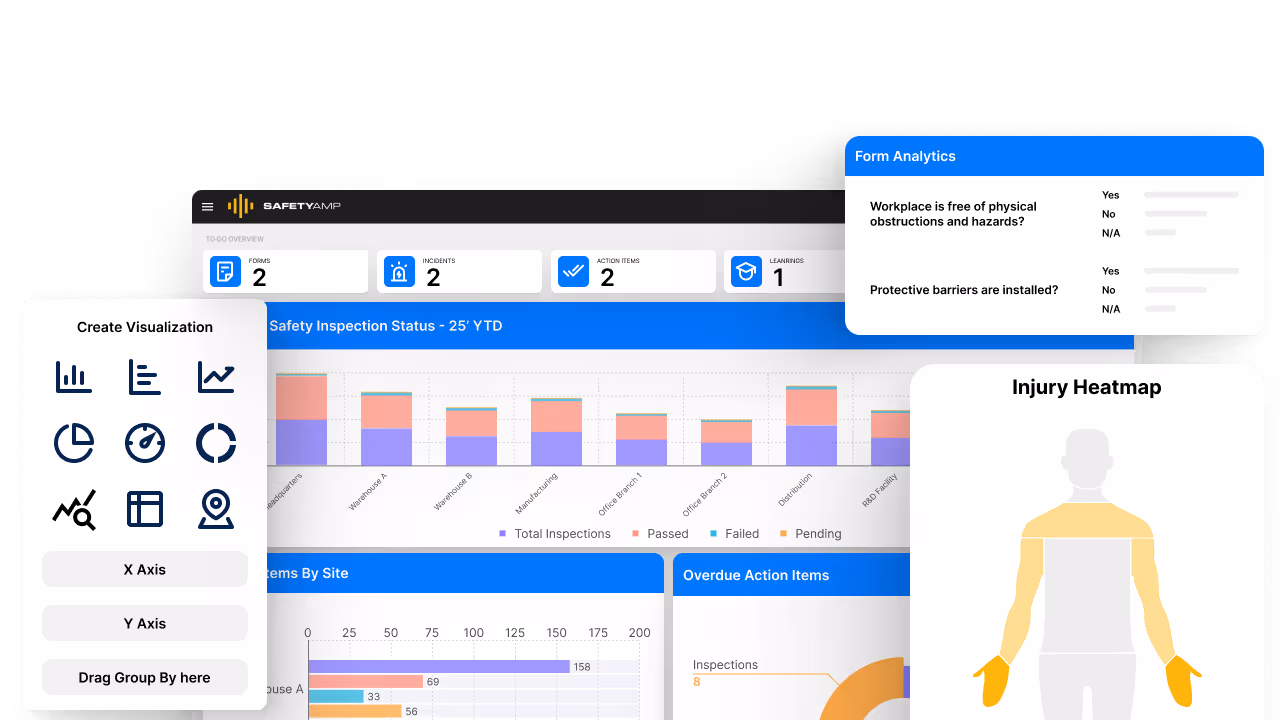


Everything you need to create a dashboard that fits your needs.
Configurable report editor allows you to decide what data should be visible.
Monitor proactive safety behaviors to stay ahead of incidents.
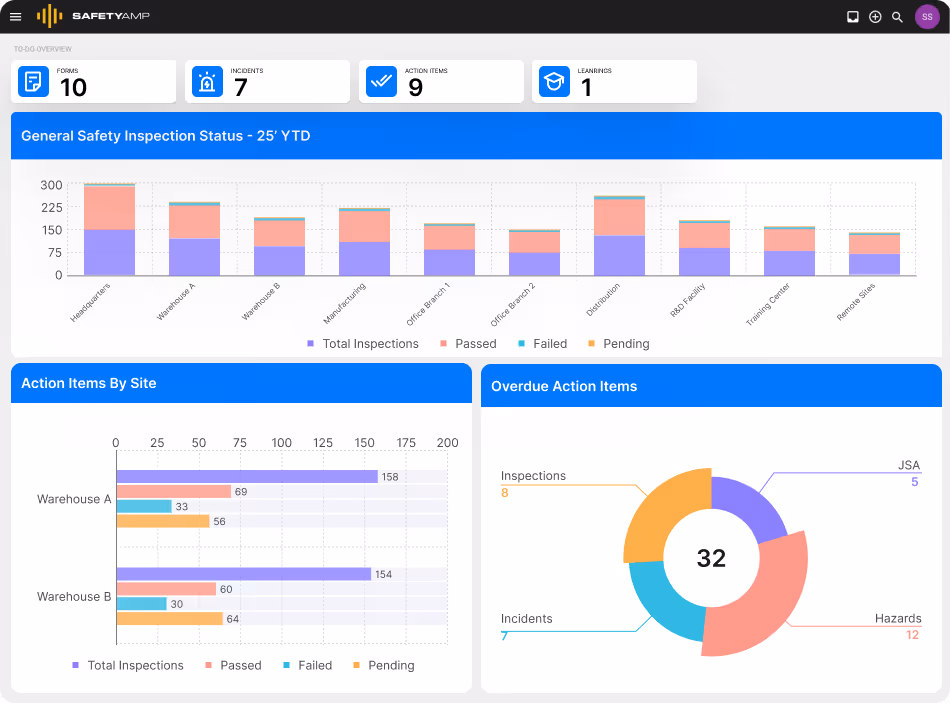
Setup dashboards for different roles and responsibilities across locations.
Review past incidents and outcomes to guide future improvements.


Gain complete visibility into safety and compliance data across your locations, departments, and EHSQ activities.
Track missed audits, non-conformances, frequency, scores, and more
Configurable visualizations allow you to decide how to present the data
Combine reports into dashboards and assign them by role
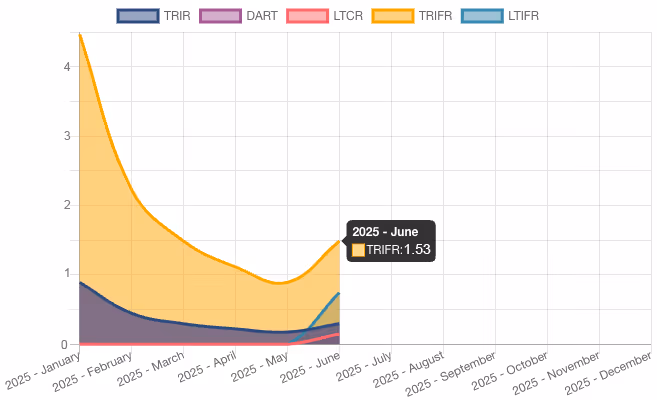
Visualize TRIR, DART, and LTCR trends with powerful dashboards that turn complex safety data into actionable insights. Monitor your safety program's effectiveness and identify areas for improvement before they become problems.
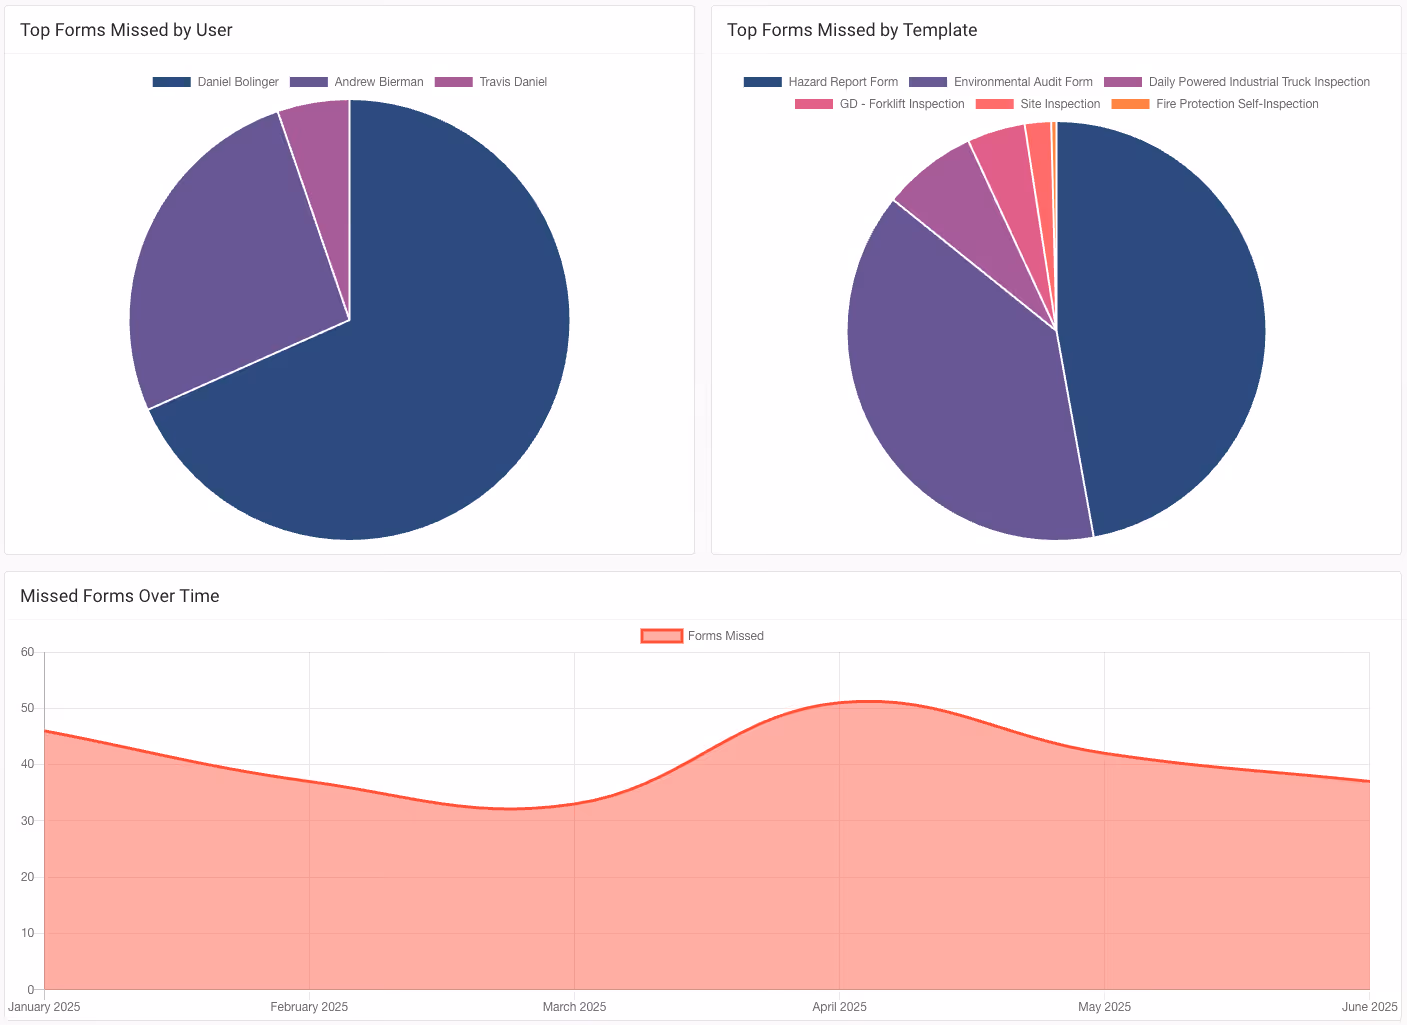
See which forms your teams complete most frequently and track completion rates across locations. Identify your most active safety programs and ensure consistent participation organization-wide.
Score Breakdown Analysis
Concerning Response Alerts
Missed Forms Tracking
Trend Intelligence
Proud Multi Year Award Winner for Excellence in Safety and Compliance Solutions


Case Studies
Learn how SiteSense reduced annual energy usage by 1.4 million kWh despite a 5% increase in production.
Applying digital transformation to EHS with the rapid deployment of mobile safety applications.
SII standardized and digitally transformed EHSQ reporting and administrative processes company-wide.


Made in the U.S.A.
© Copyright 2026